

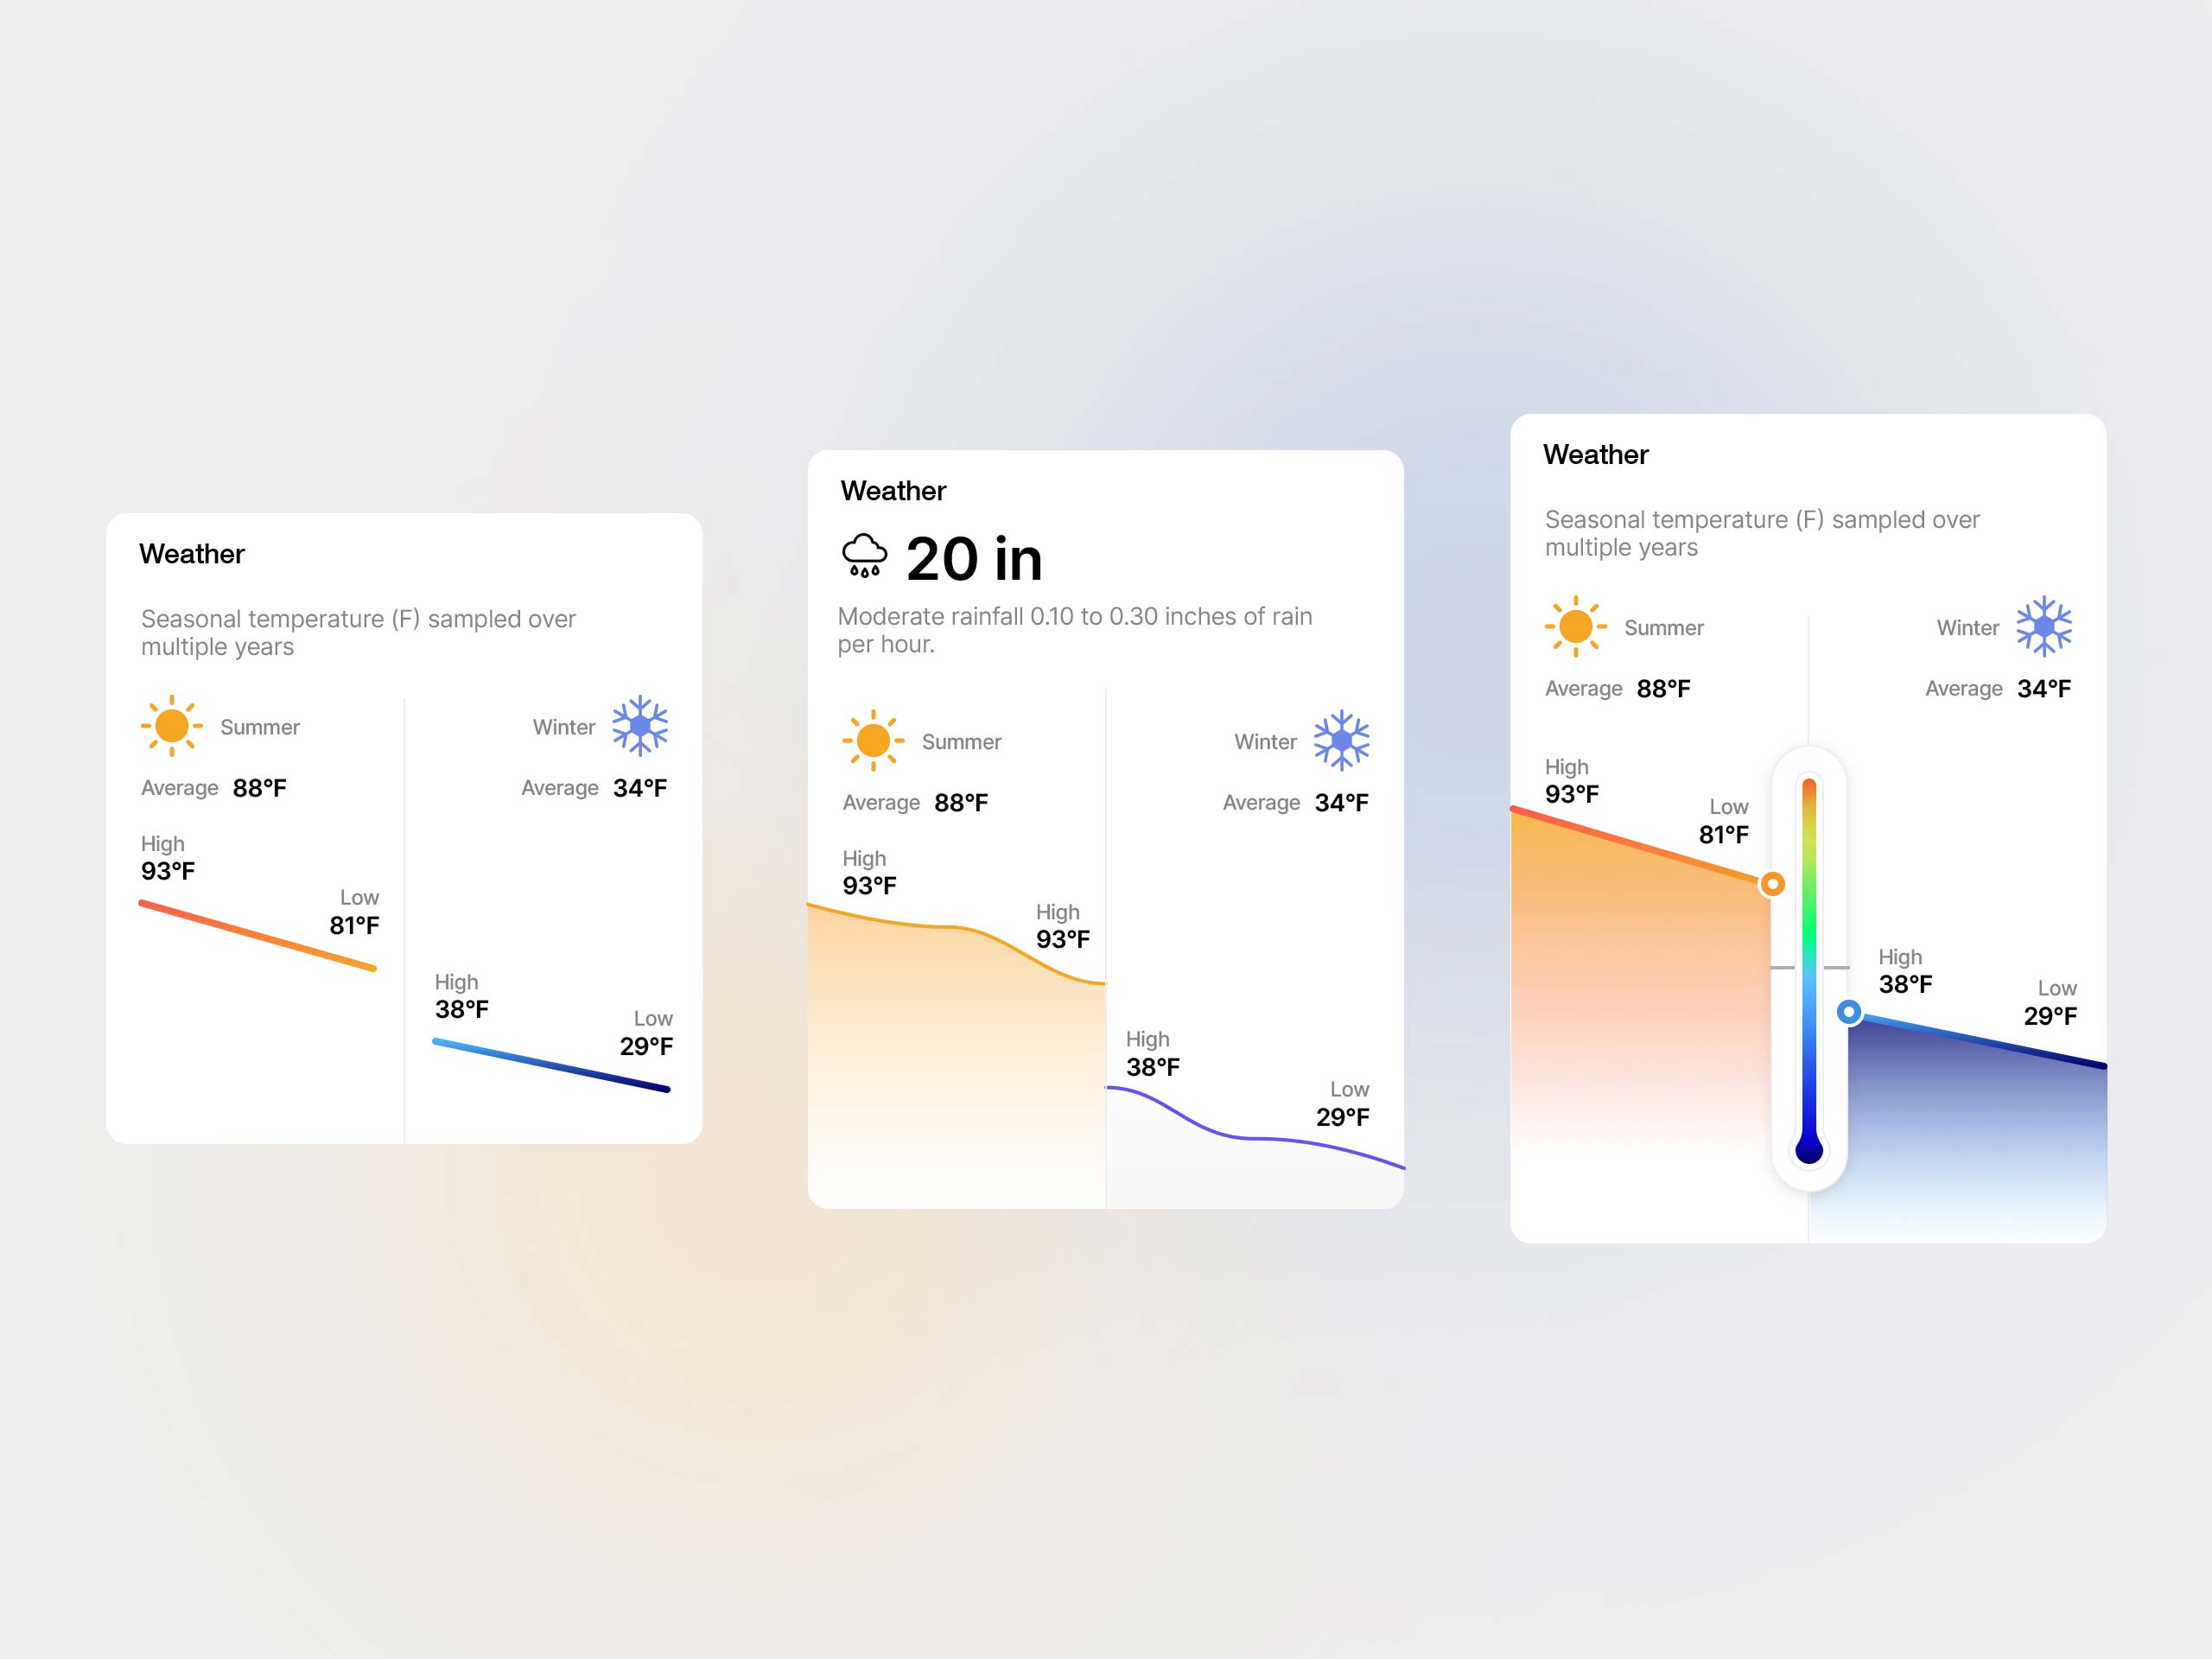
A series of TopHap weather UI concepts developed to make seasonal climate data easier to compare at a glance. The designs explore different ways to present average, high, and low temperatures for summer and winter, alongside precipitation information. Line charts, filled areas, and a temperature-scale visualization were tested as part of the broader TopHap design system for property reports and location-based analytics.