

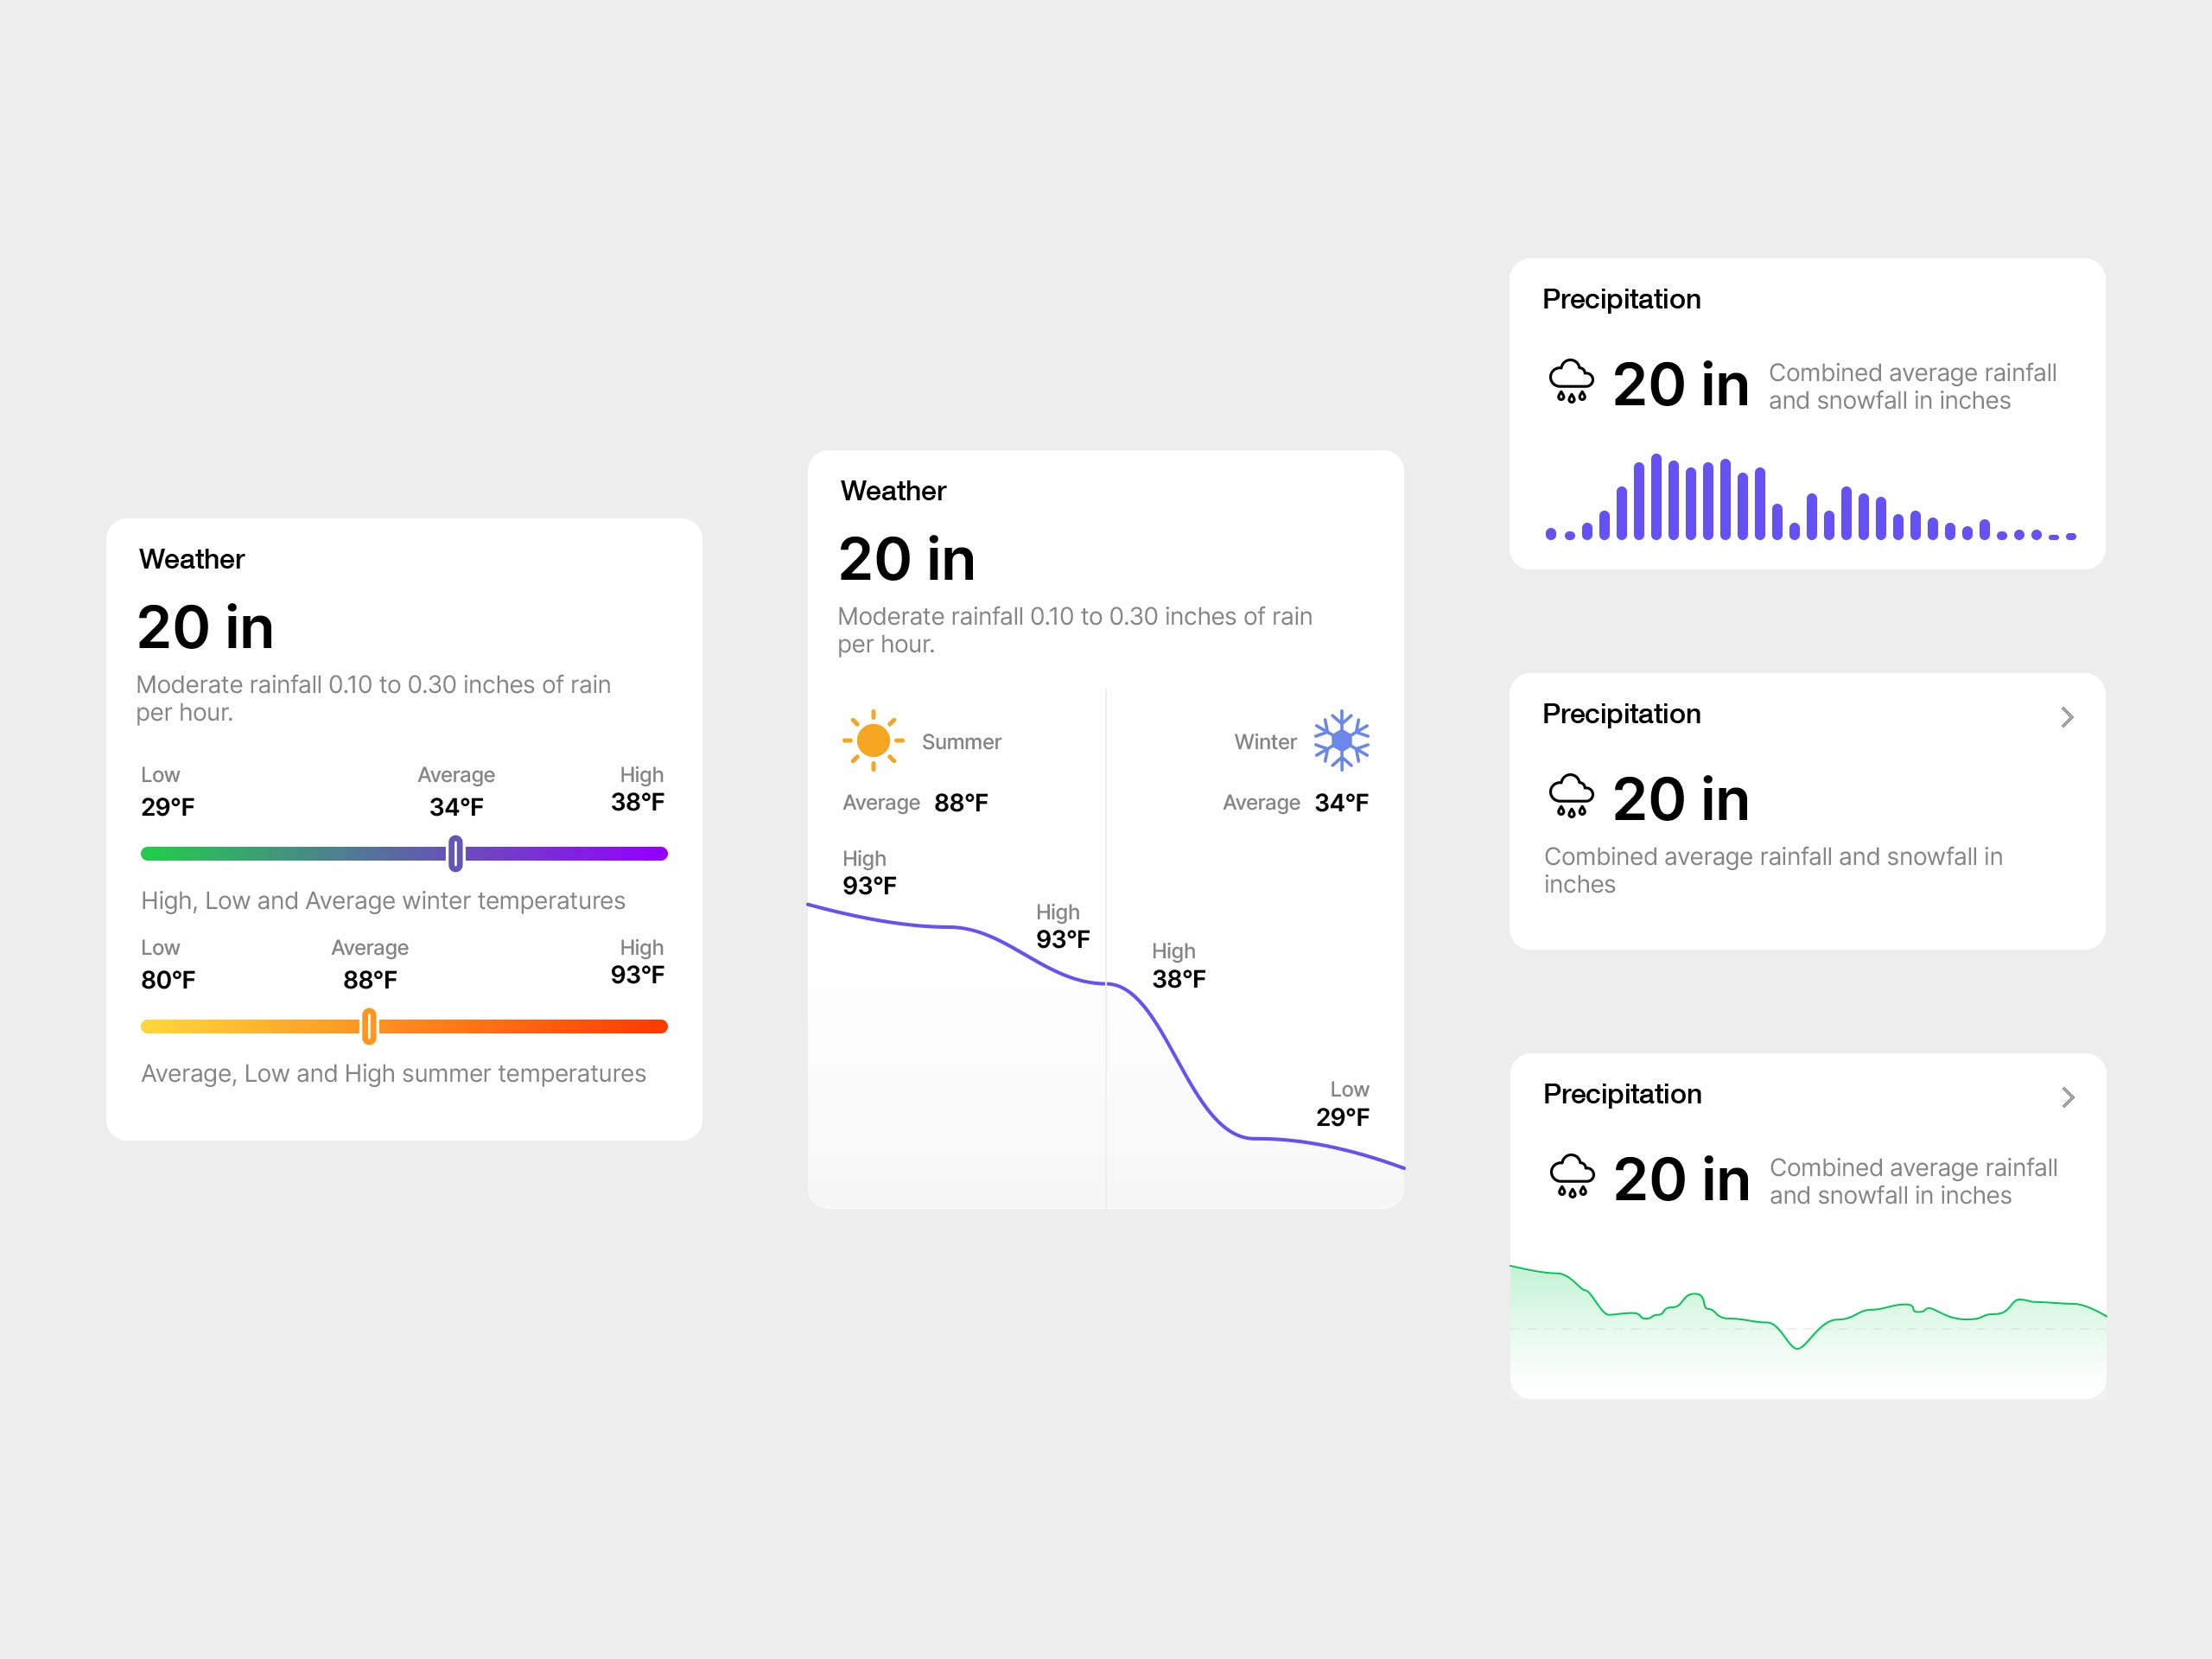
A set of TopHap UI explorations focused on weather and precipitation data. The concepts test different ways to communicate seasonal temperature ranges, average rainfall and snowfall, and environmental trends using scales, curves, bars, and compact summary cards. These components were developed as part of the broader TopHap design system, helping translate dense location-based data into clear, reusable interface patterns across property reports and analytical experiences.