

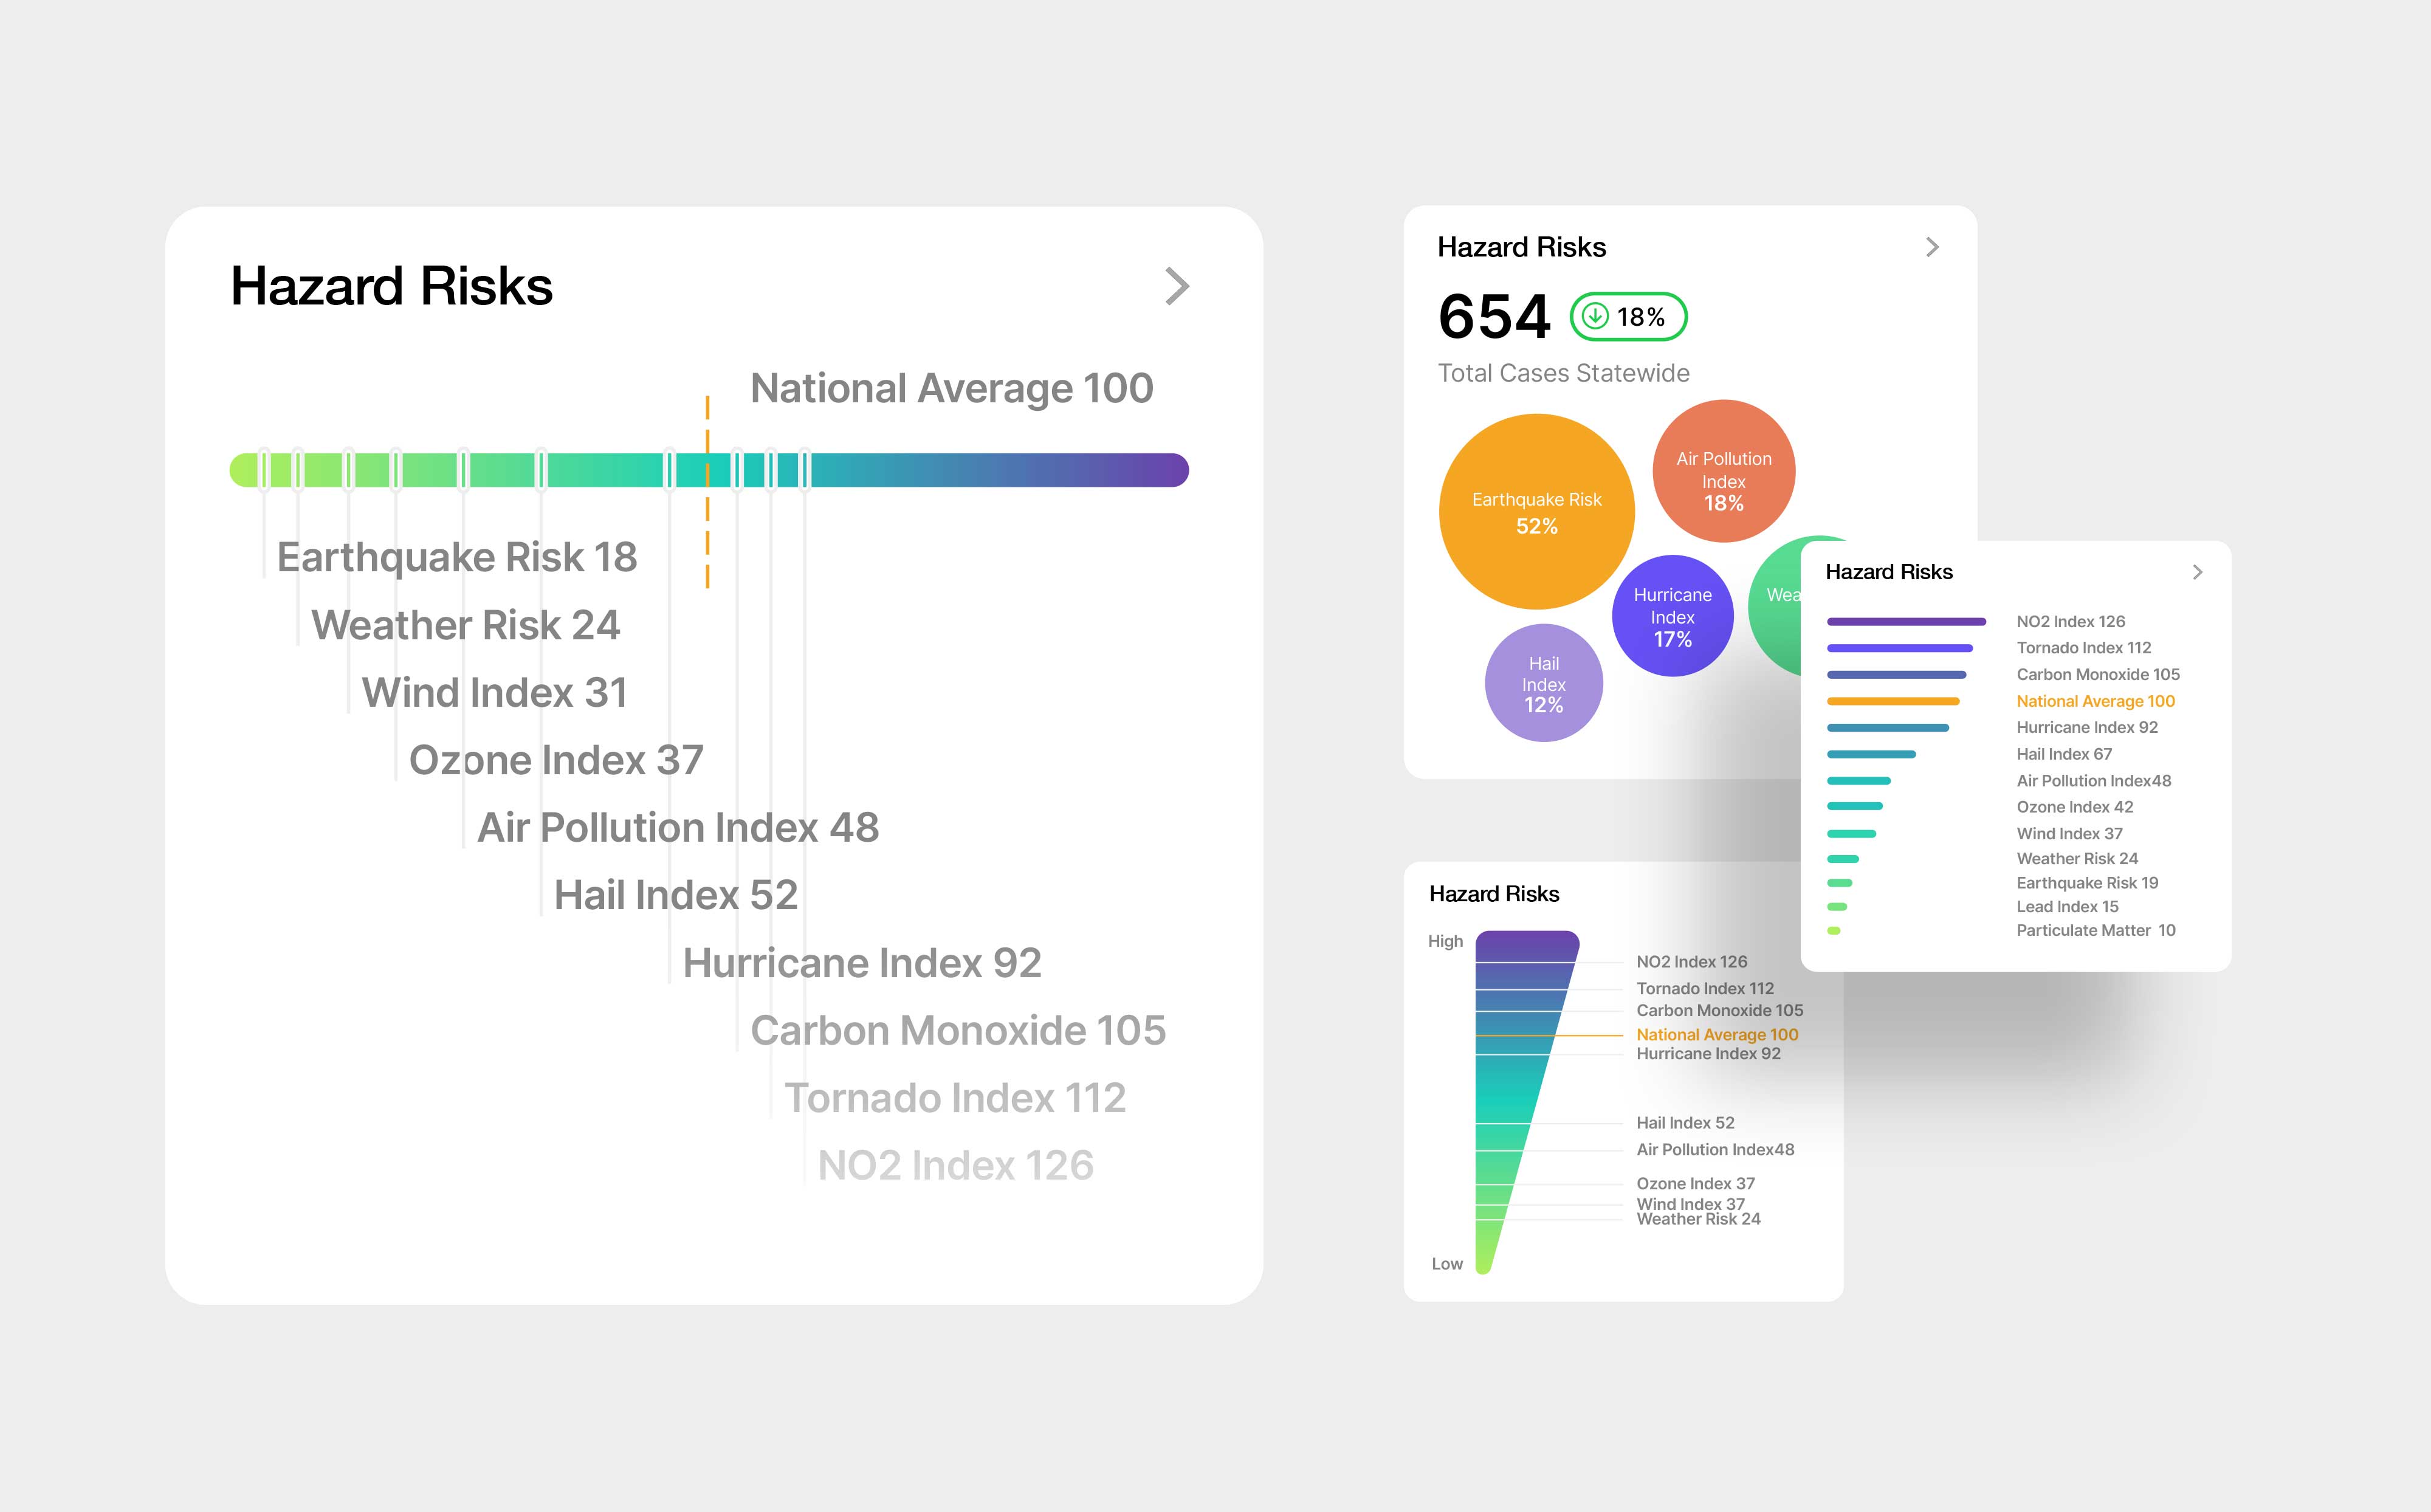
A series of TopHap Hazard Risks visualization concepts developed for property reports and analytical interfaces. The designs explore different ways to organize and compare indicators such as earthquake, hurricane, tornado, air pollution, weather, and wind risk against a national benchmark. Gradient scales, ranked bars, and comparative charts were tested to turn a dense set of environmental risk metrics into a clearer and more scannable decision-making tool.