

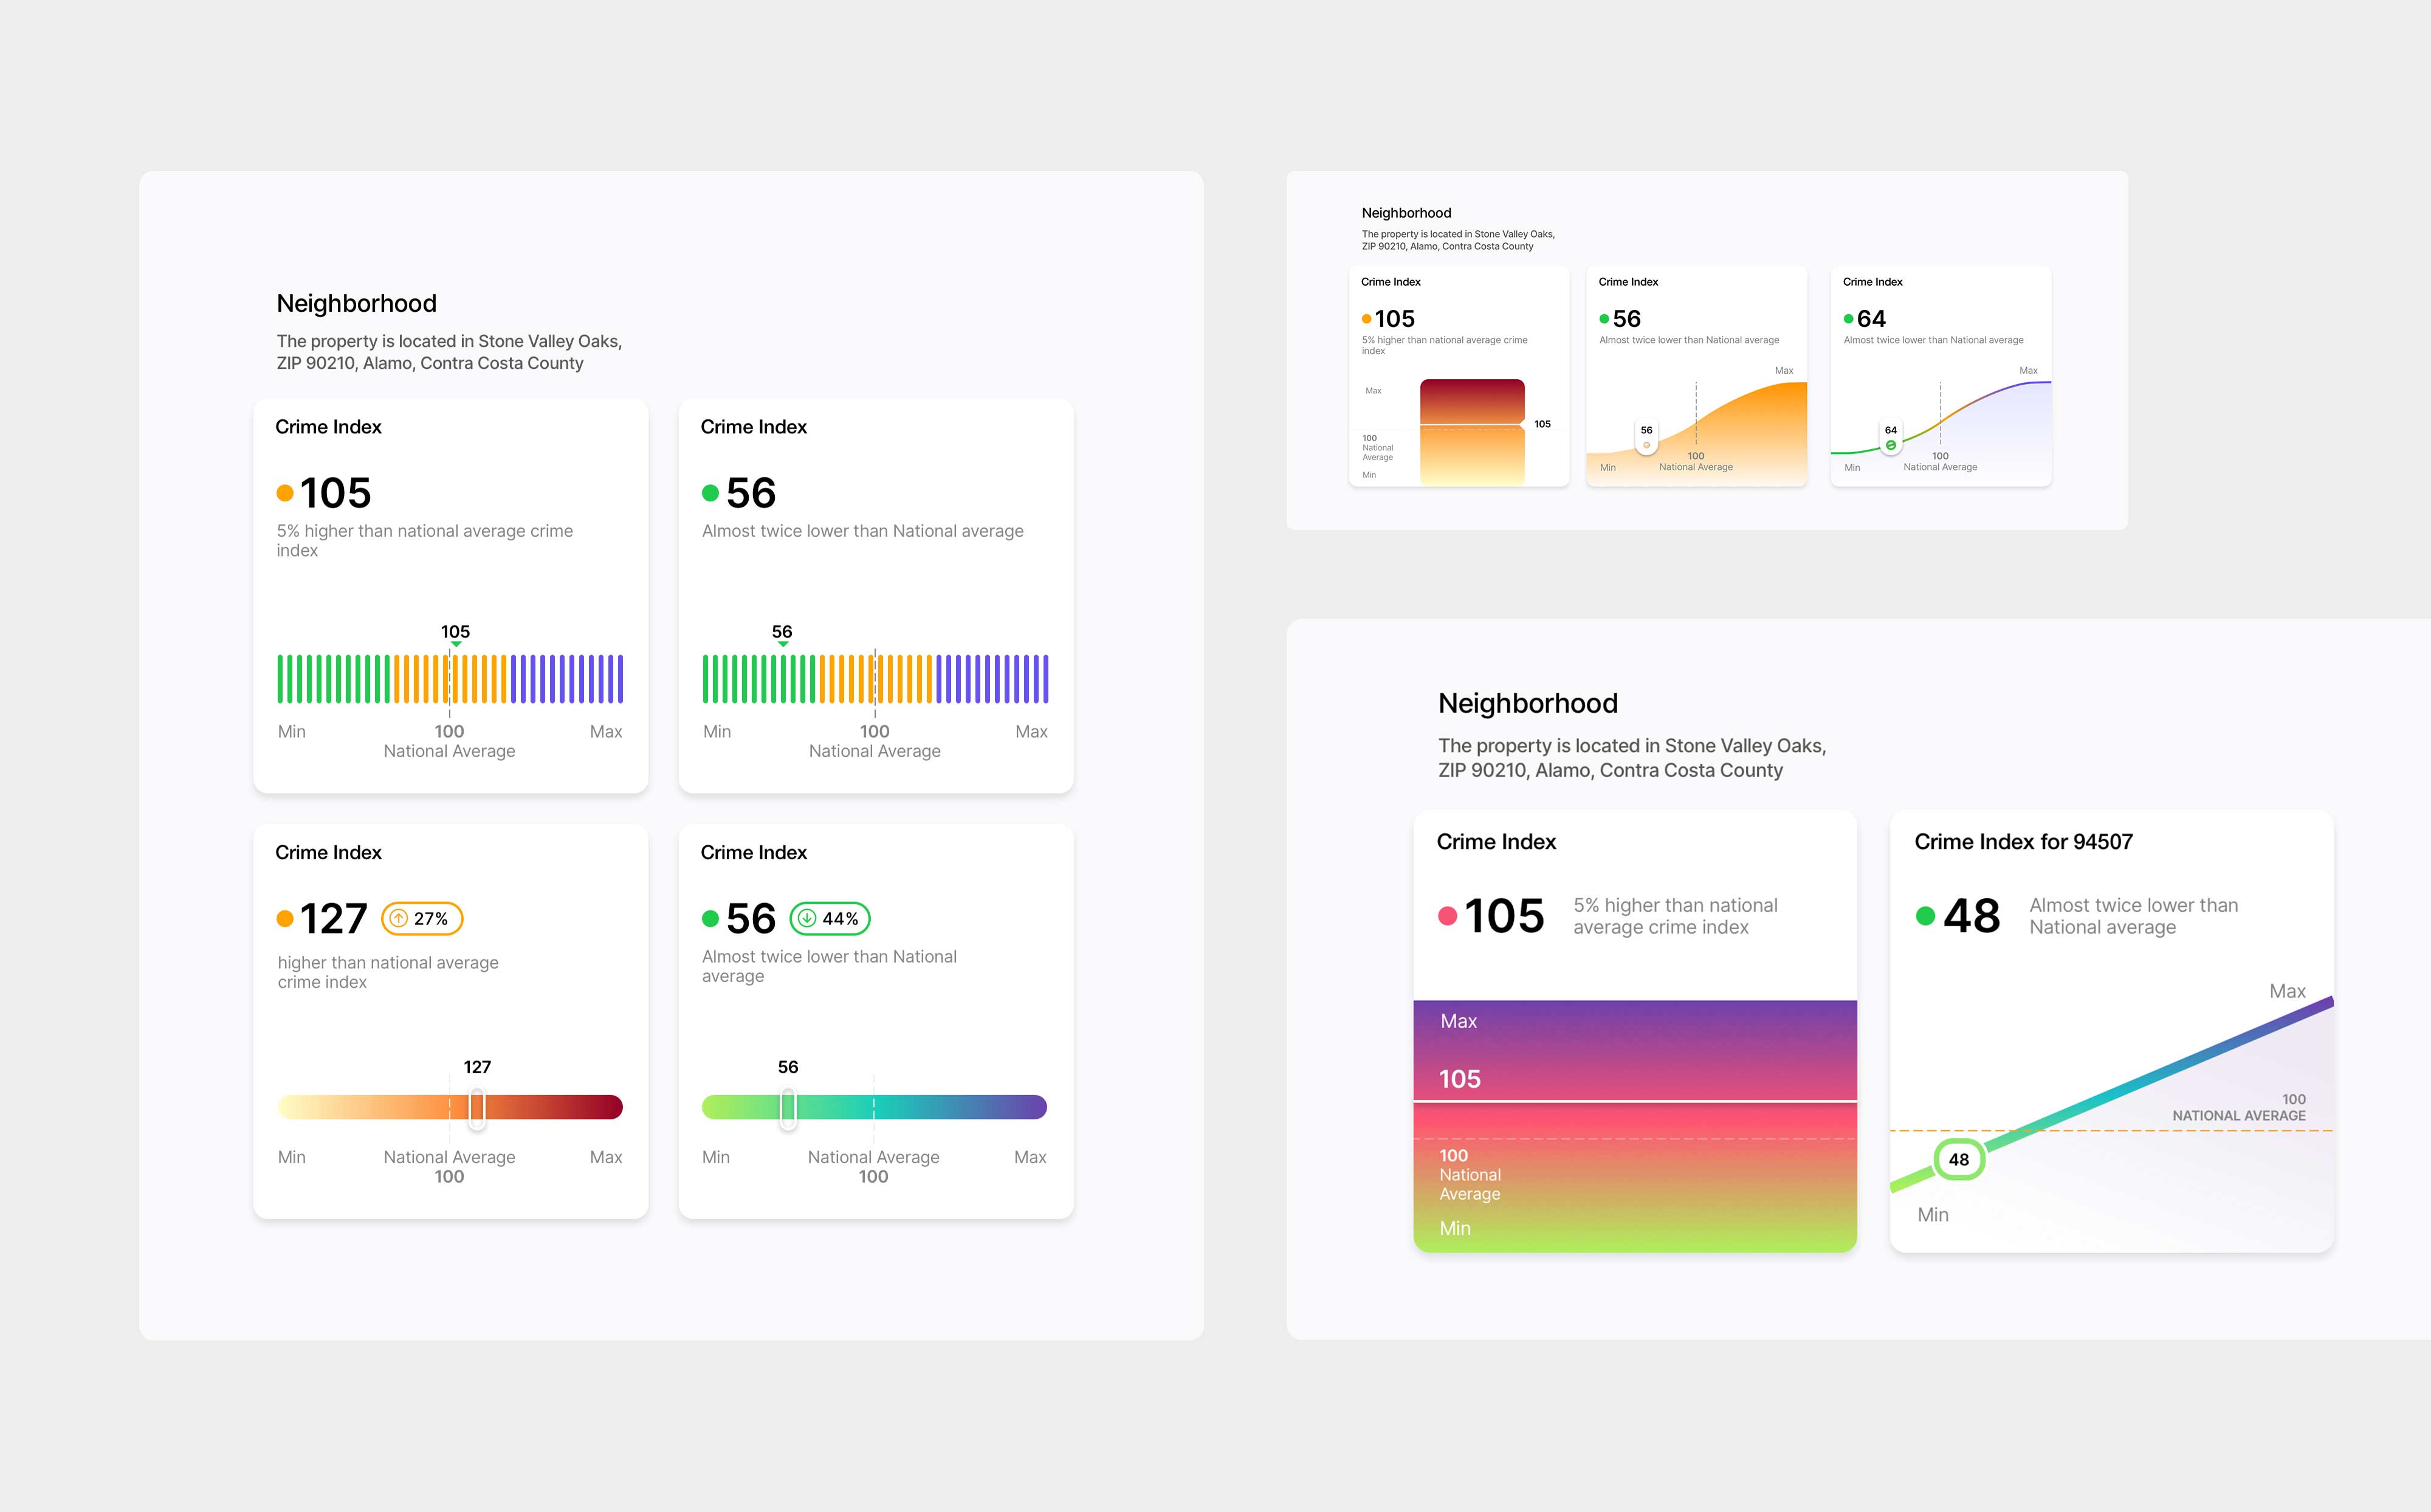
A series of TopHap Crime Index visualization concepts developed for the neighborhood section of property reports. The explorations test different approaches—including segmented scales, gradients, benchmark lines, and curve-based charts—to communicate whether a location’s crime index is above or below the national average. The goal was to find a visual language that made comparative neighborhood data quick to understand while remaining consistent with the broader TopHap analytics system.