

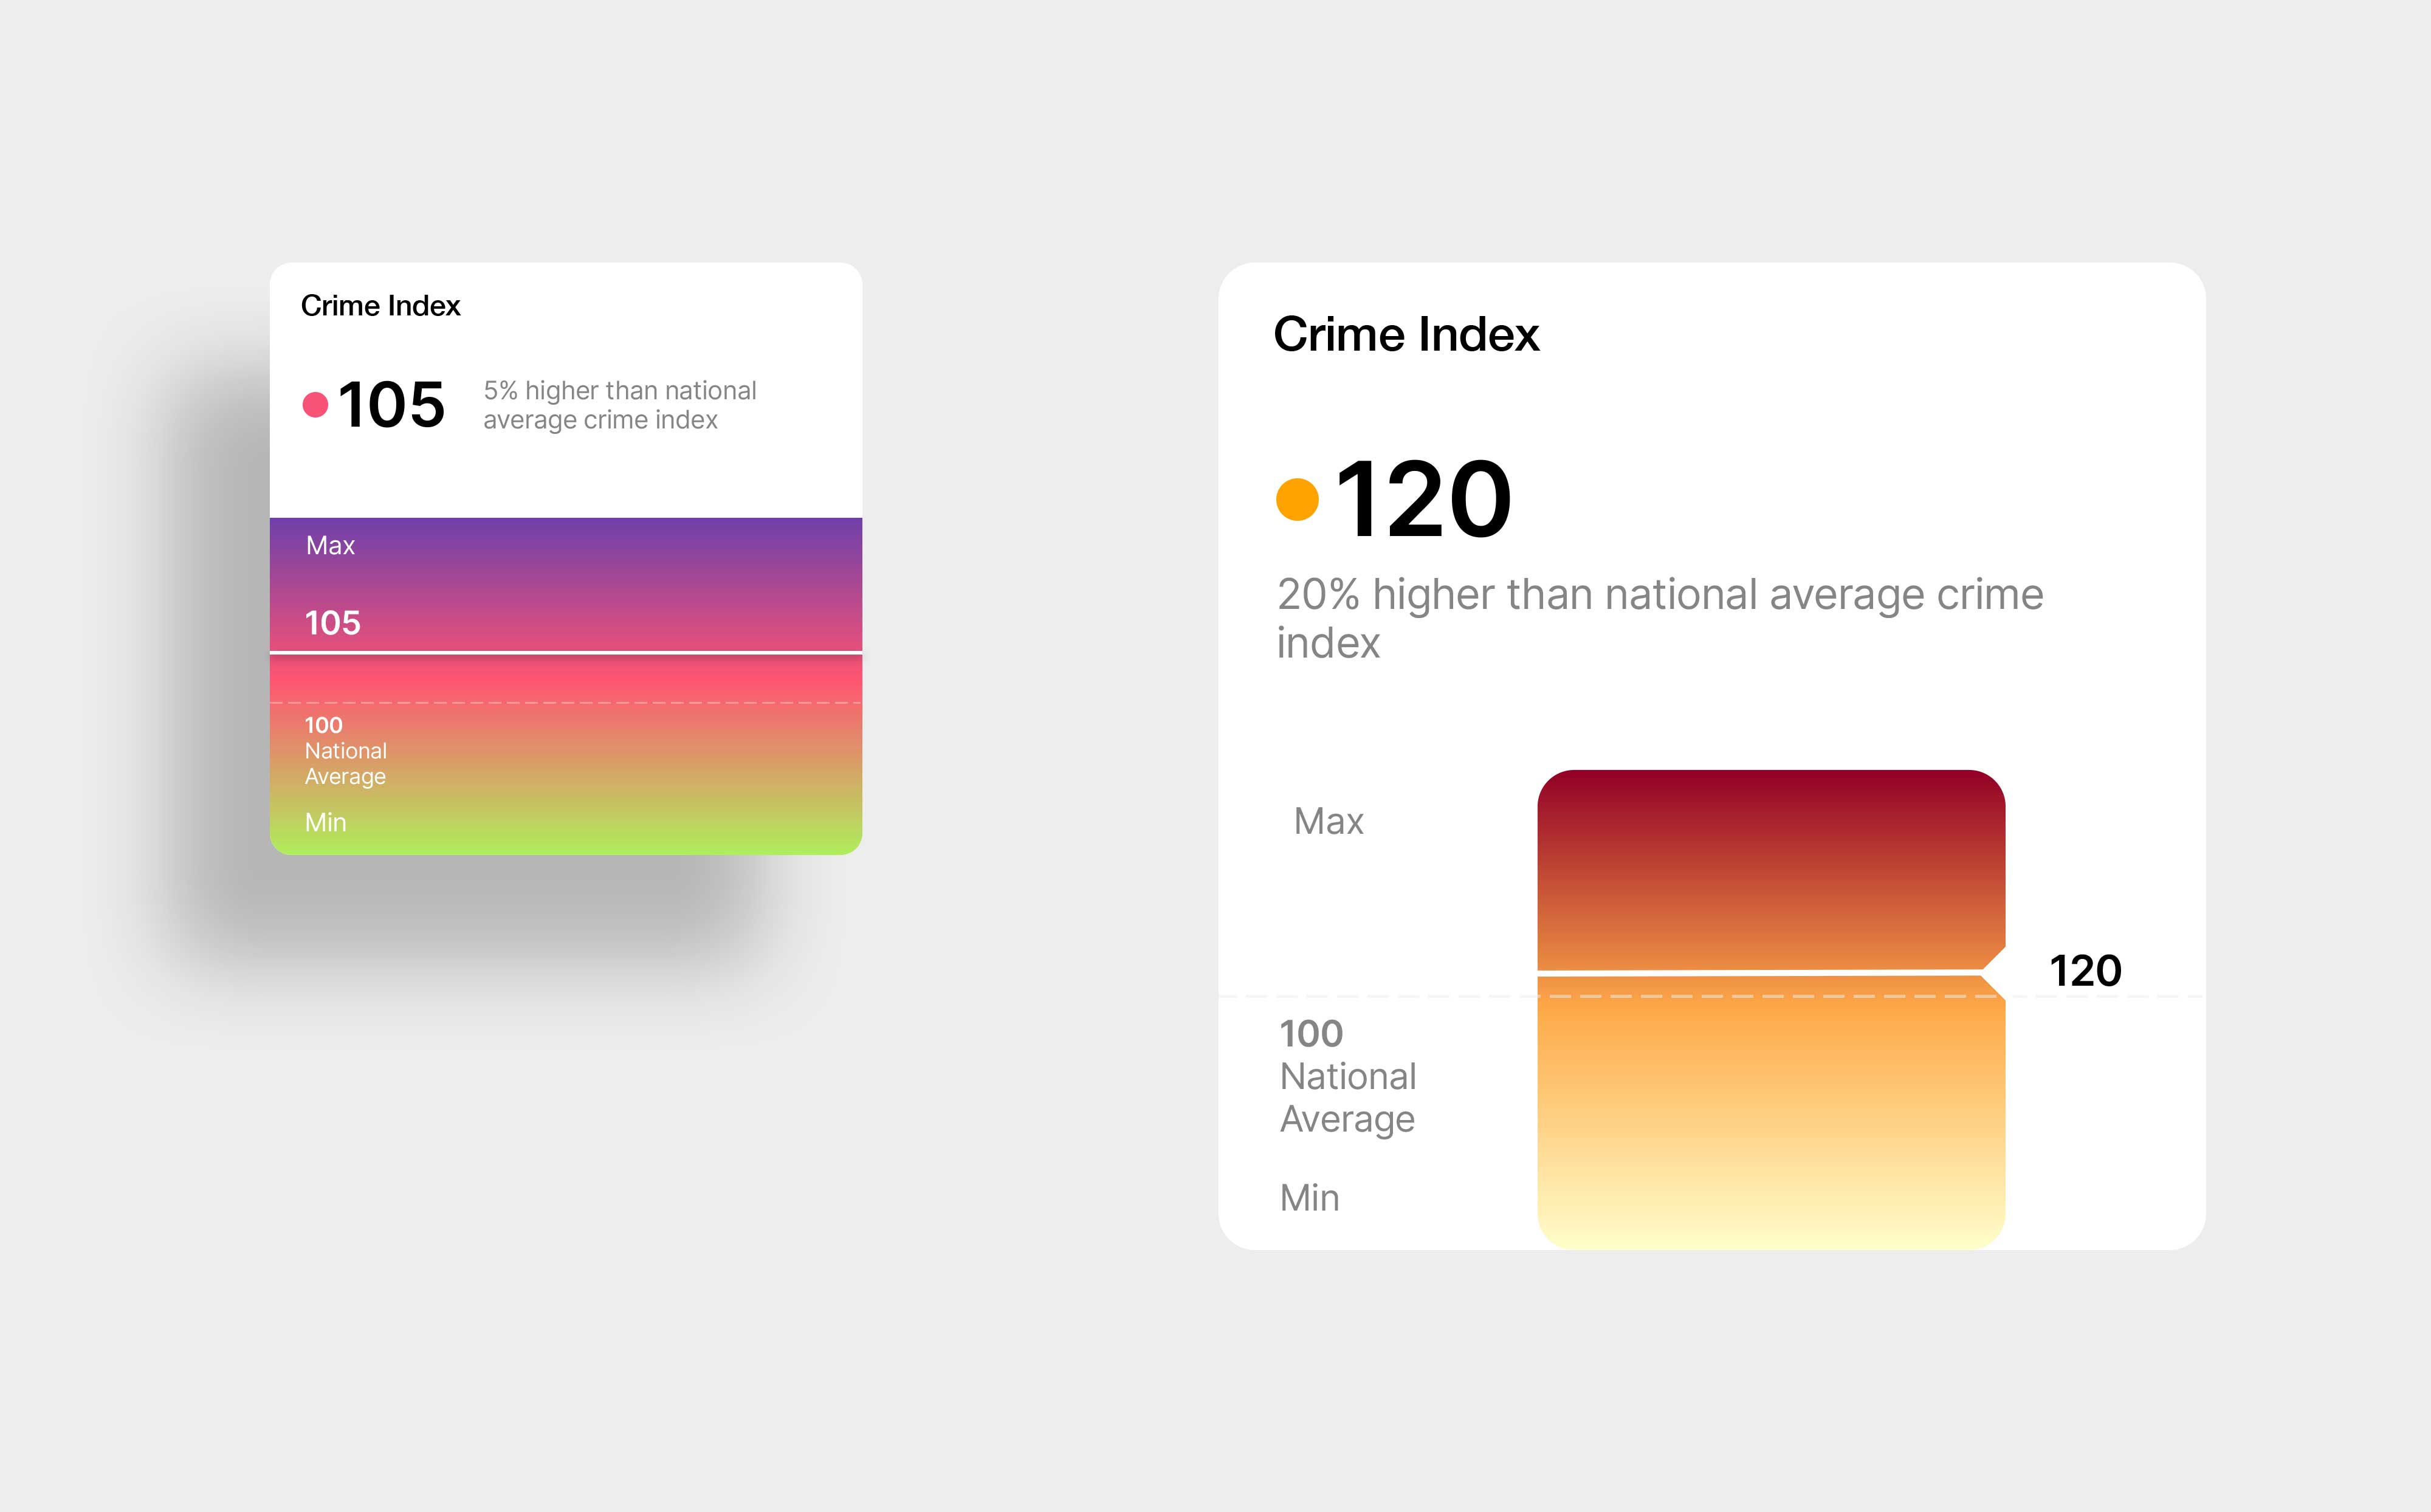
UI concepts for presenting the TopHap Crime Index across the web platform and property reports. The visualization combines a numeric score, national benchmark, and color scale to help users quickly understand how a location compares with the national average. The iterations explore different levels of visual emphasis and information density while keeping the metric easy to interpret within a broader real estate analytics experience.