

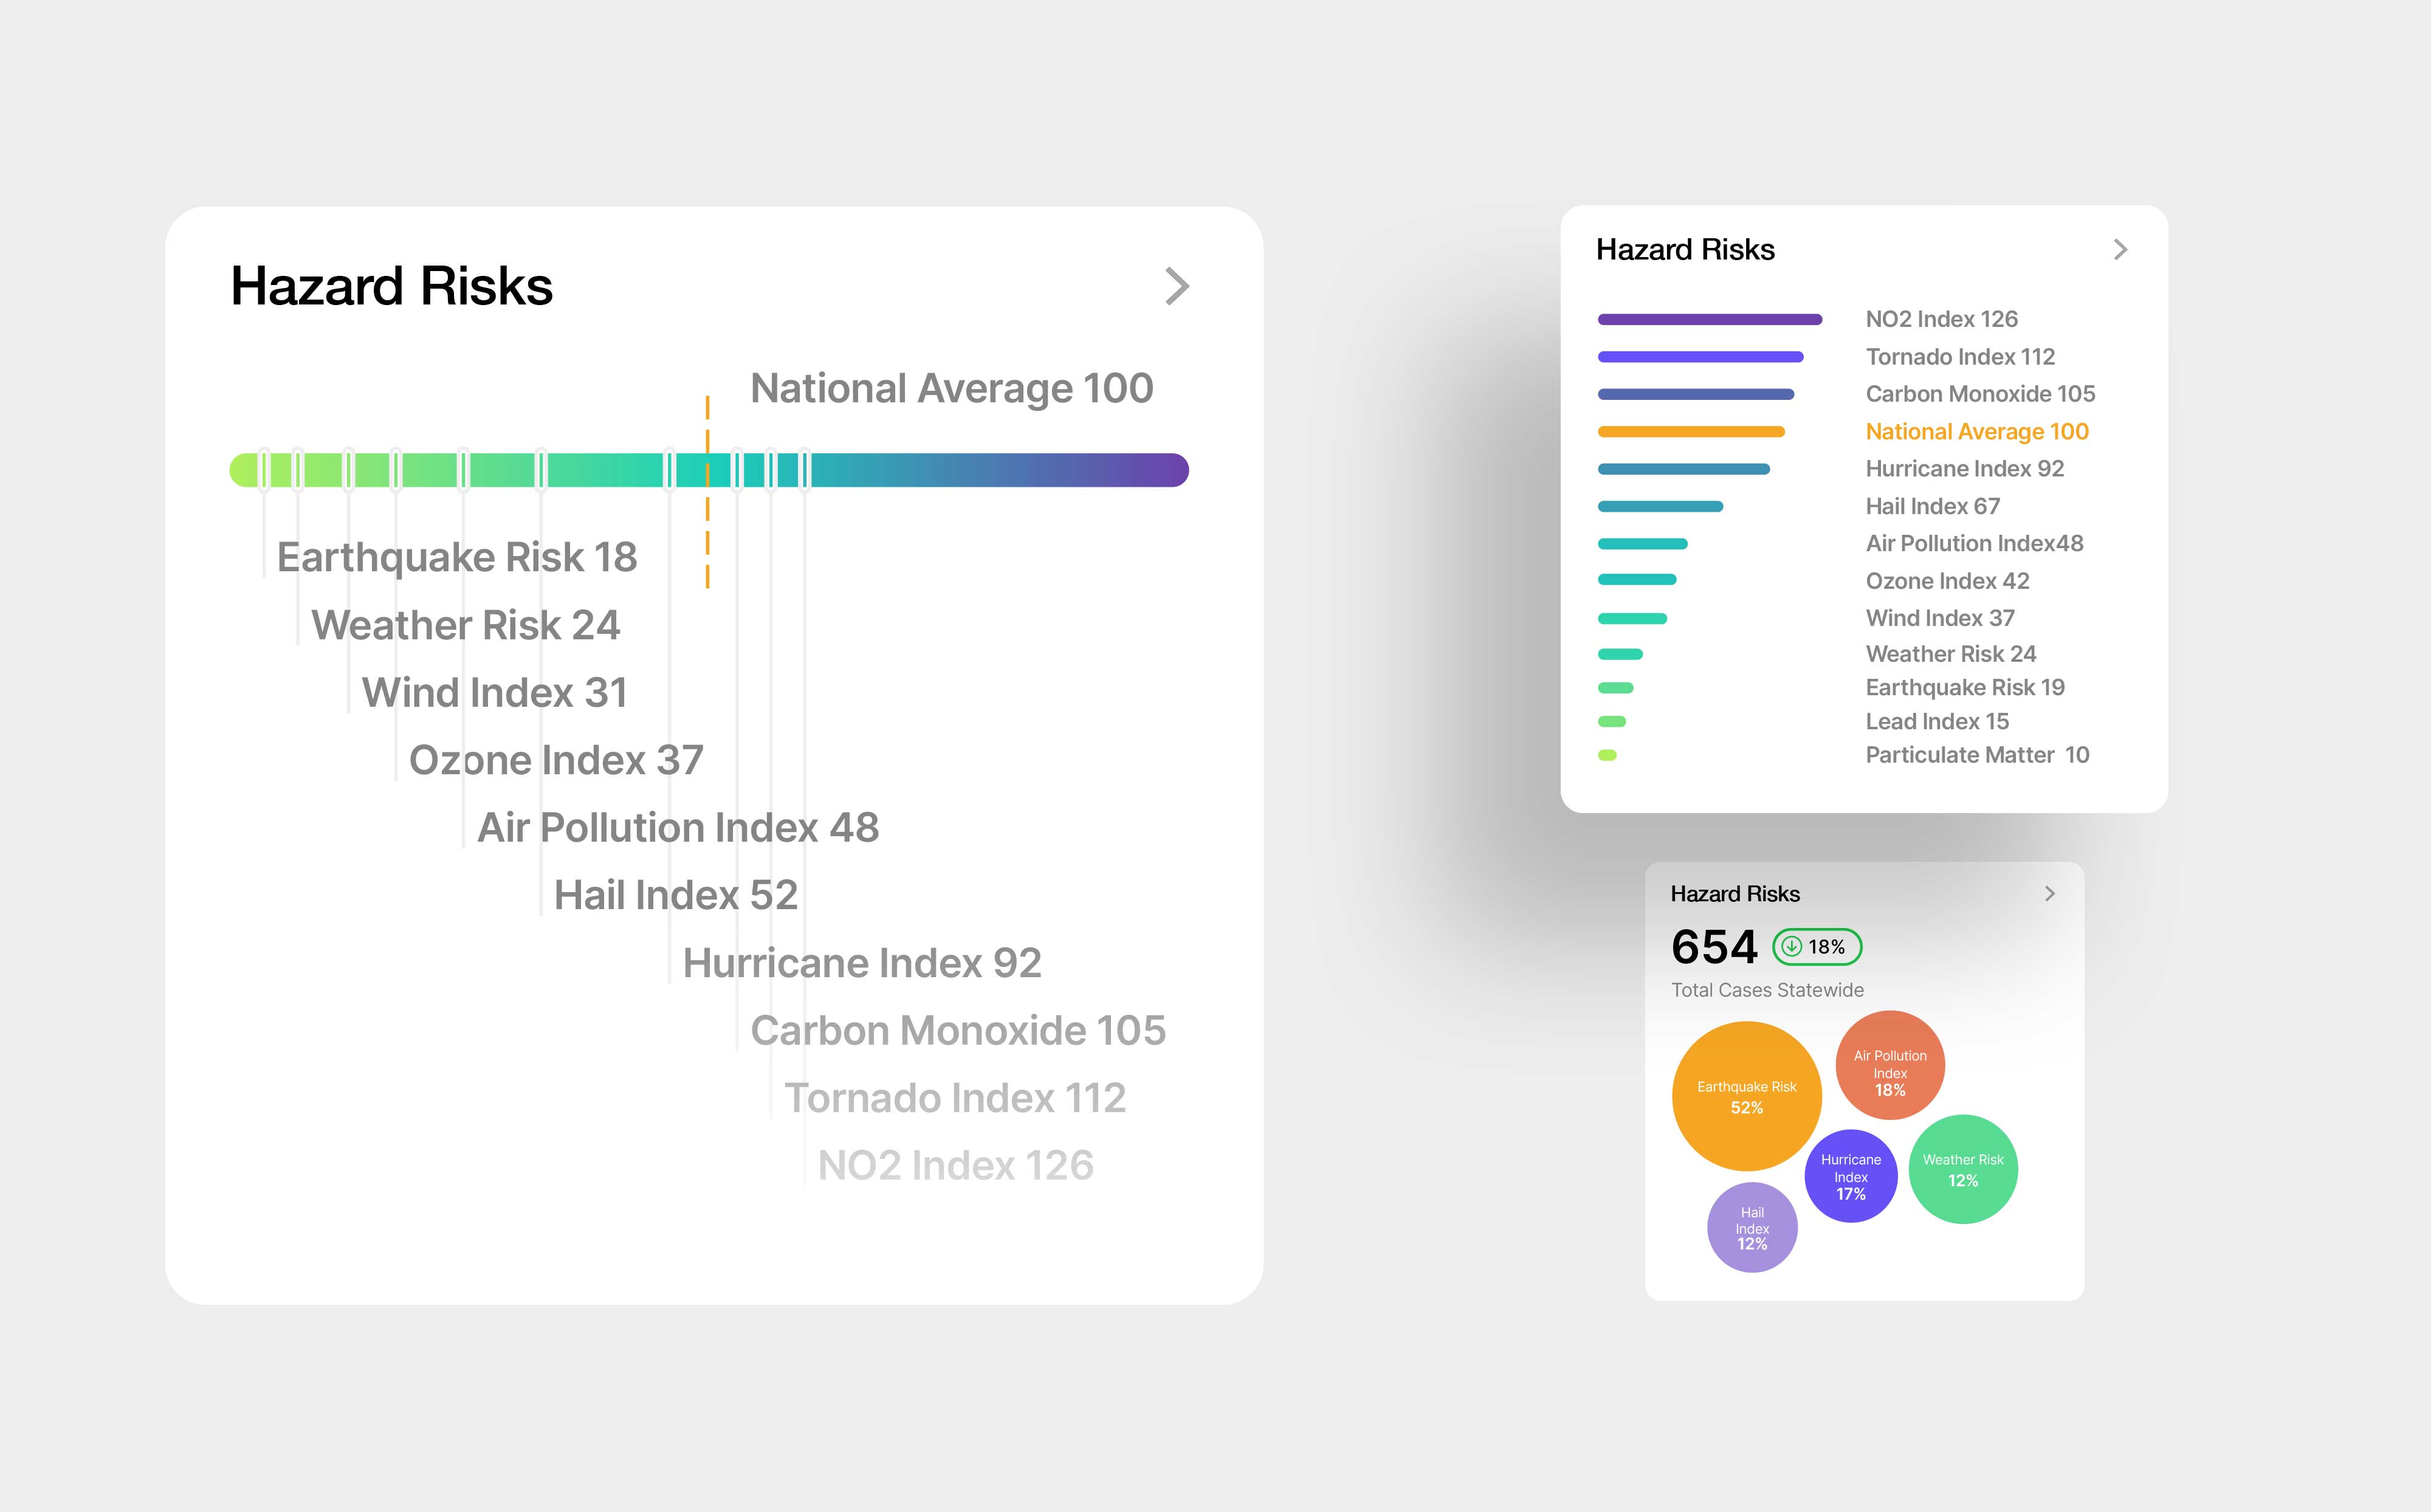
A set of TopHap Hazard Risks interface explorations focused on making complex environmental and natural hazard data easier to scan and compare. The concepts organize metrics such as earthquake, weather, wind, ozone, air pollution, hail, hurricane, carbon monoxide, tornado, and NO2 indices around a national-average benchmark. Different formats—including ranked bars, gradient scales, and summary bubbles—were tested to balance data density, hierarchy, and quick interpretation across web and report experiences.