

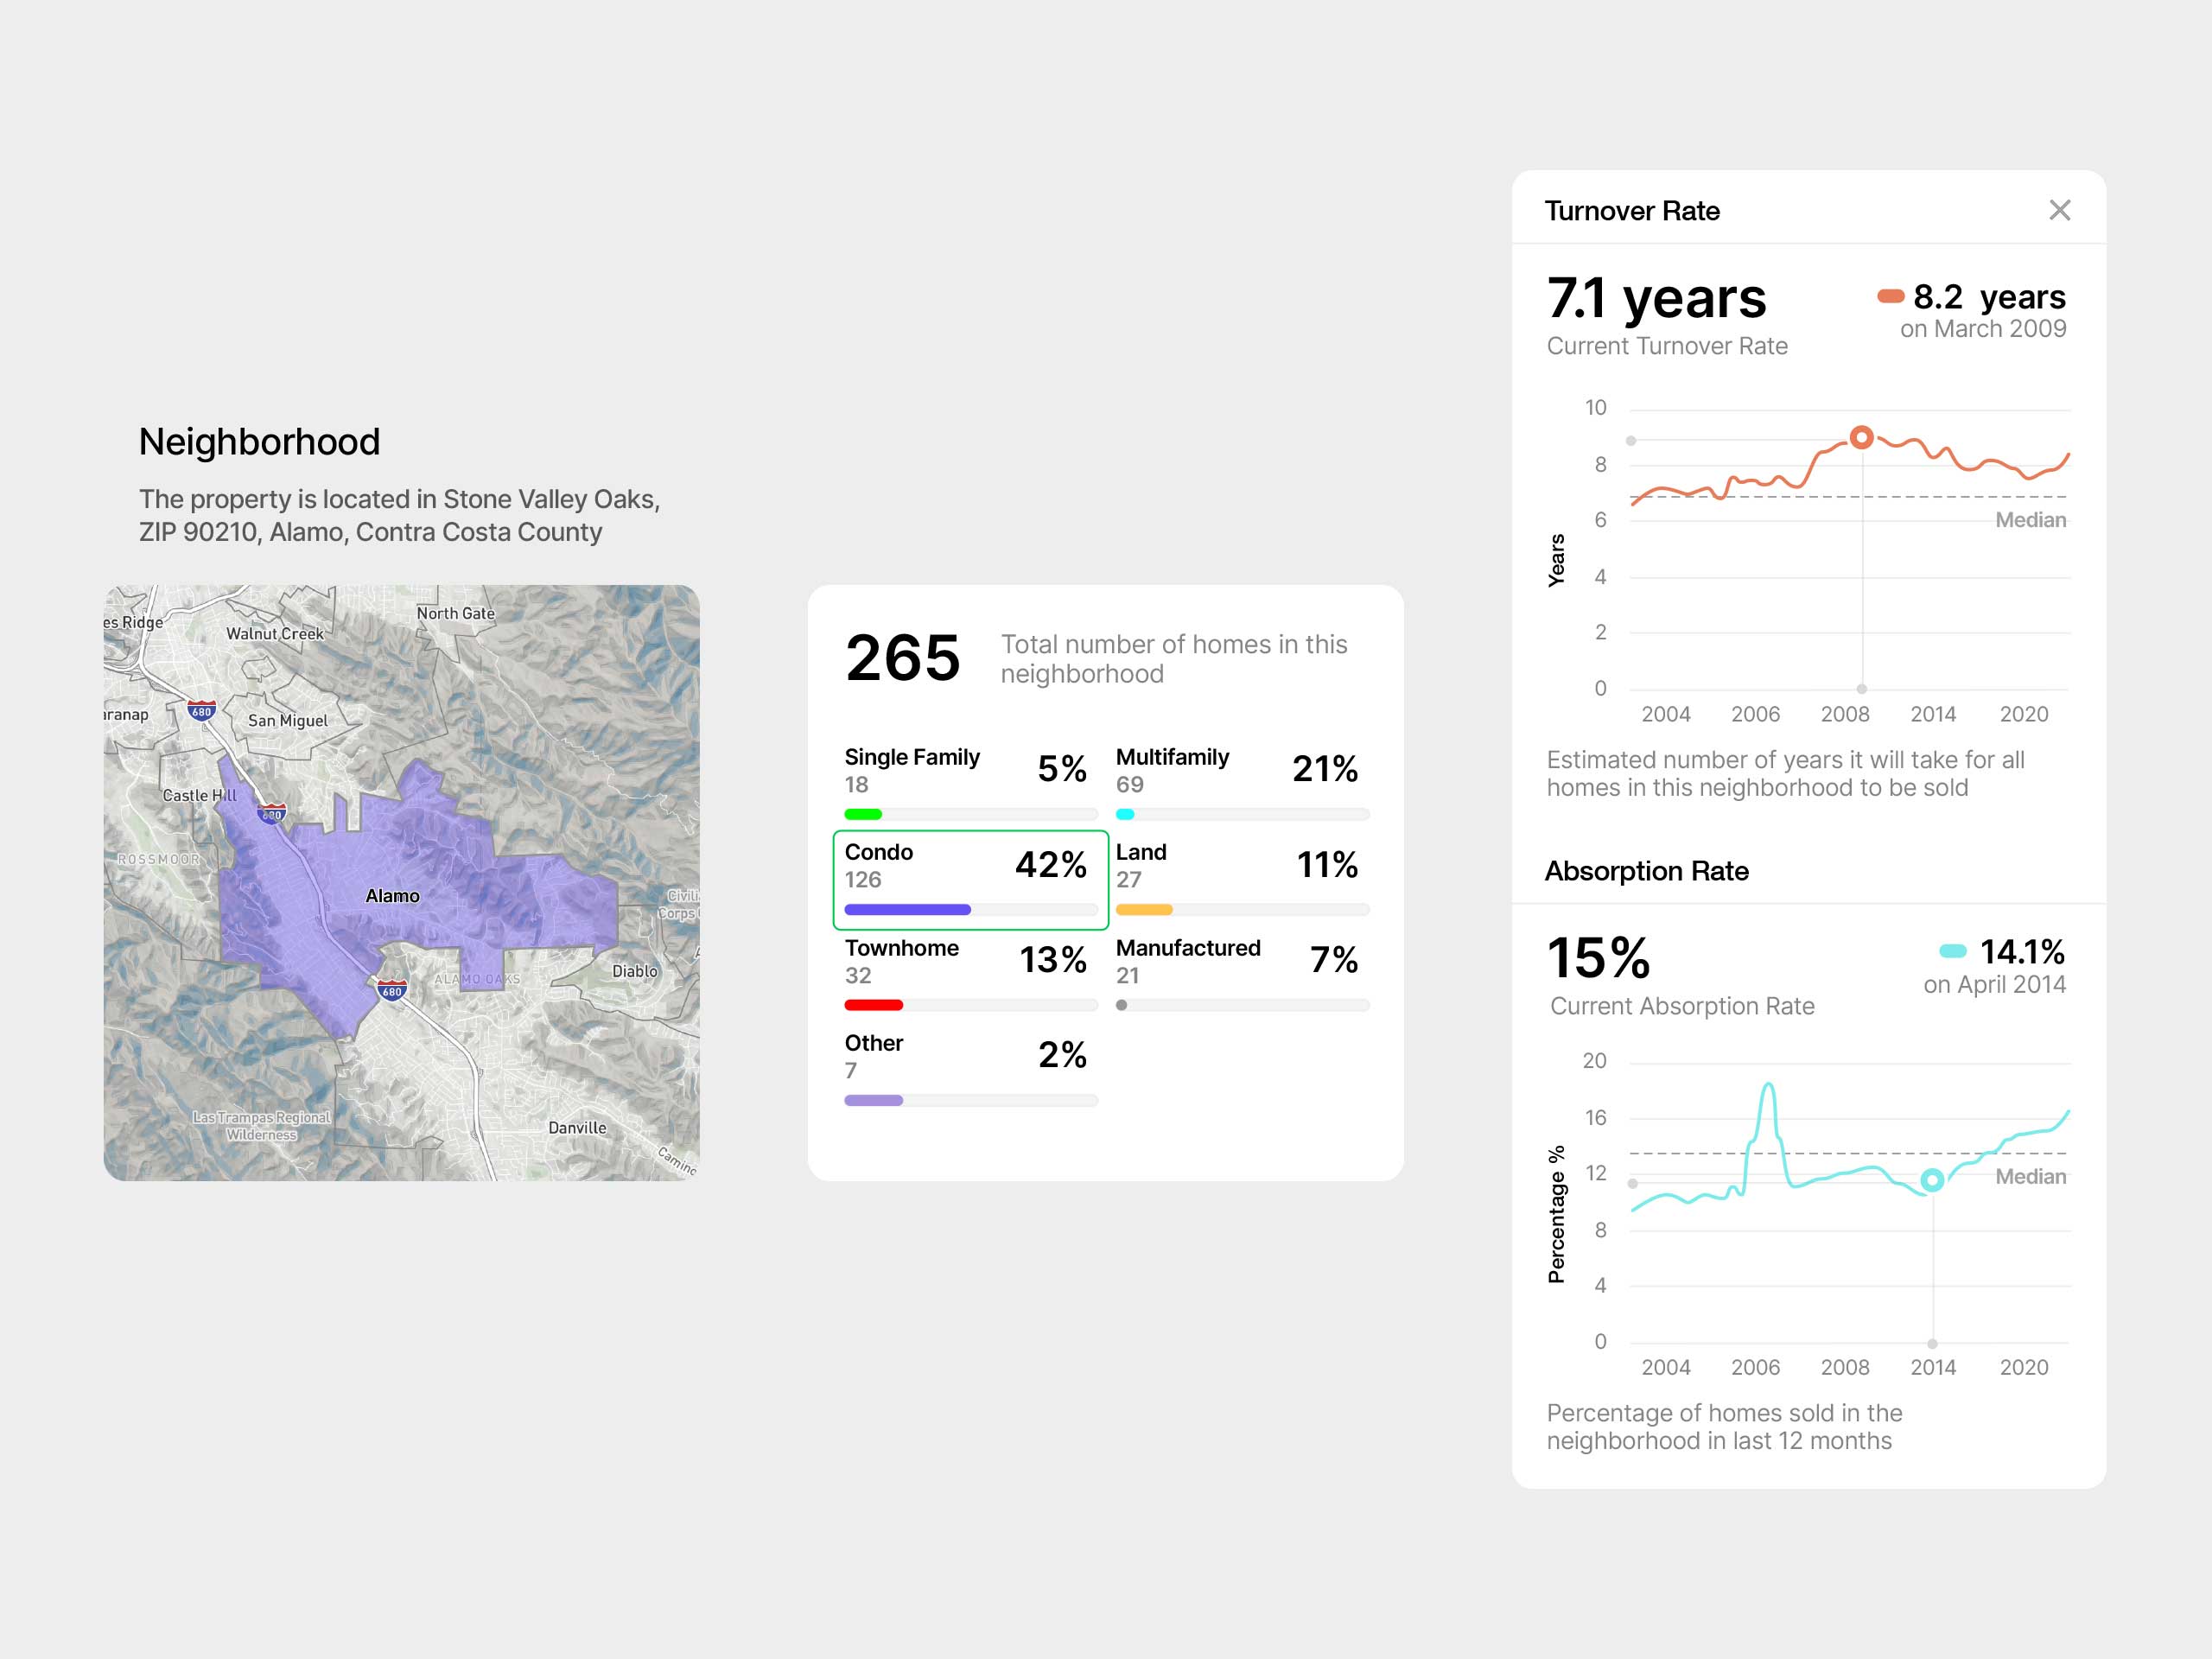
A set of TopHap neighborhood analytics components developed to make local market conditions easier to understand at a glance. The interface combines mapped neighborhood boundaries, housing-type distribution, total home counts, turnover rate, and absorption rate with historical trend charts and median benchmarks. These components formed part of the broader TopHap design system, translating complex neighborhood and market data into reusable, decision-oriented visual patterns.